

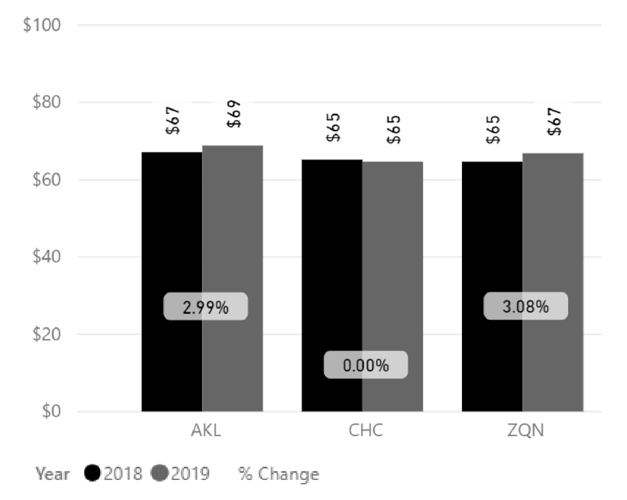
Fig. 1
Refer to sales channels (Fig.2), duration (Fig.3) and vehicle category (Fig.4) graphs for the average rates during the month. As was the trend in prior months, the average rates for the shorter 3-day duration remains strong.
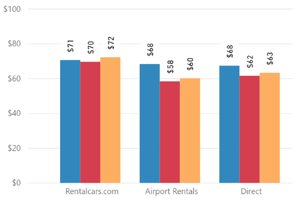
Fig. 2
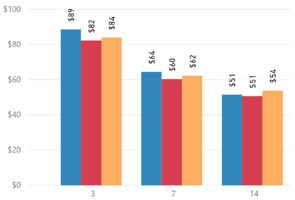
Fig. 3
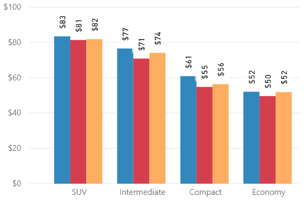
Fig. 4
Overall Auckland Airport had a YoY average rate increase of +3%.
Rentalcars.com sales channel showed an average rate increase of +9%, while Airport Rentals and the direct channels showed decreases of -4% and -1% respectively (Fig. 5).
The average rate for 3-day duration increased +16%, while the average rate for longer 7-day was flat, and 14-day duration -16% (Fig. 6).
The average rate for SUV’s in Auckland was flat YoY, with all other categories showing average rates of between +5% and +16% (Fig. 7).
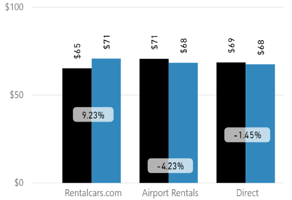
Fig. 5
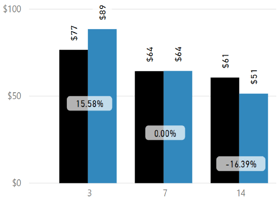
Fig. 6
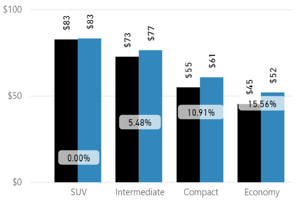
Fig. 7
Overall Christchurch Airport had a flat YoY average rate.
Rentalcars.com sales channel showed an average rate increase of +4%, while Airport Rentals and the direct channels showed decreases of -9% and -2% respectively (Fig. 8).
The average rate for 3-day durations increased +6%, while the average rate for longer 7-day and 14-day durations were lower by -3% and -11% respectively (Fig. 9).
The average rate for SUV’s was down -1%, with all other categories increasing between +2% and +9% (Fig. 10).
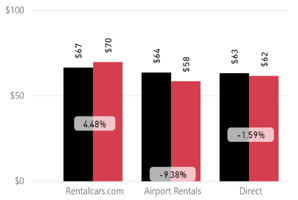
Fig. 8
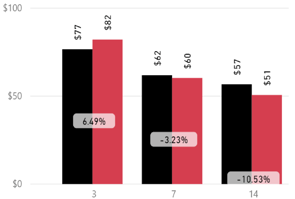
Fig. 9
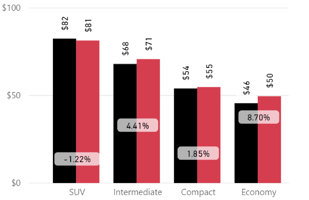
Fig. 10
Overall Queenstown Airport had a YoY average rate increase of +3%.
The rentalcars.com sales channel showed an average rate increase of +11%, while Airport Rentals and the direct channels showed decreases of between -6% and 0% respectively (Fig. 11).
The average rate for a 3-day duration increased +11%, while the average rate for longer 7-day and 14-day +2% and -6% respectively (Fig. 12).
The average rate for SUV’s was up +1%, with all other categories increasing between +6% and +16% (Fig. 13).
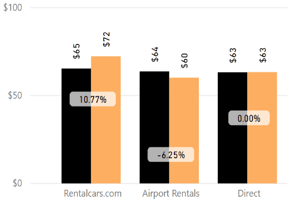
Fig. 11
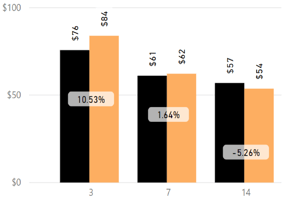
Fig. 12
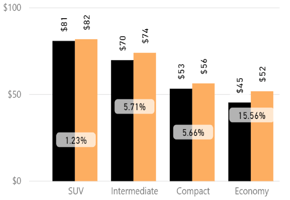
Fig. 13
Fig. 14
Fig. 15
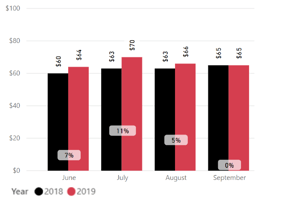
Fig. 16
Fig. 17
Overall average rates for the coming months are soft (Fig.18). The early average rate build from mid-December 2019 is encouraging, however, rates from October to mid-December 2019 are lower than prior year (Fig.19 to Fig.21).
Market Insider Tip:
The back end of the Winter season (late September to October 2019) was strong compared to prior year.
There is a period of potential YoY weakness from October to mid-December 2019, and rates during this period will require active management and careful channel distribution.
However, keep one eye on the Auckland build profile to ensure fleet is on hand in Auckland to service upcoming demand.
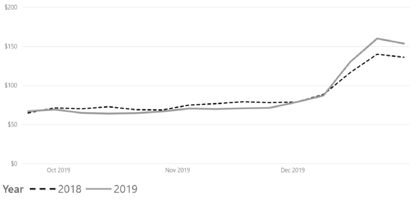
Fig. 18
Fig. 19
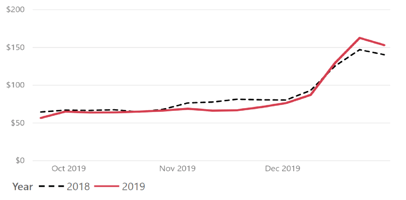
Fig. 20
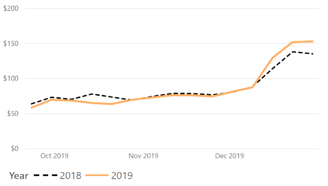
Fig. 21
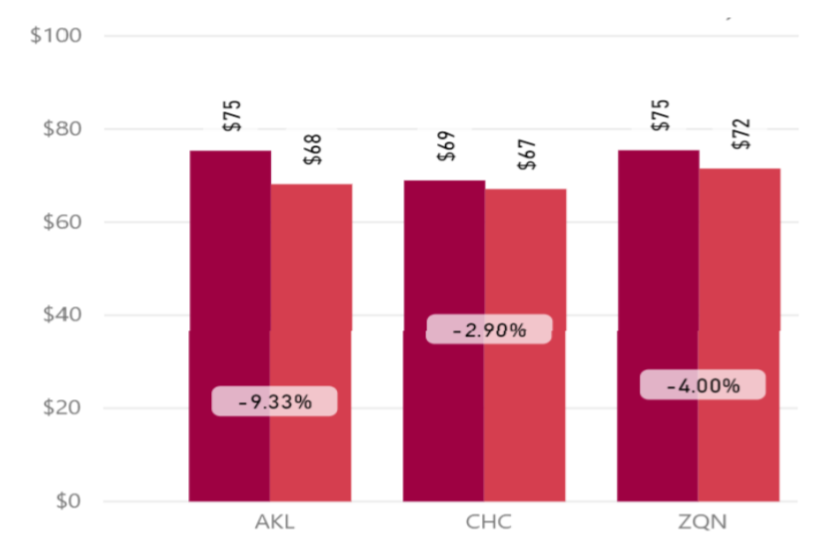
Fig. 22
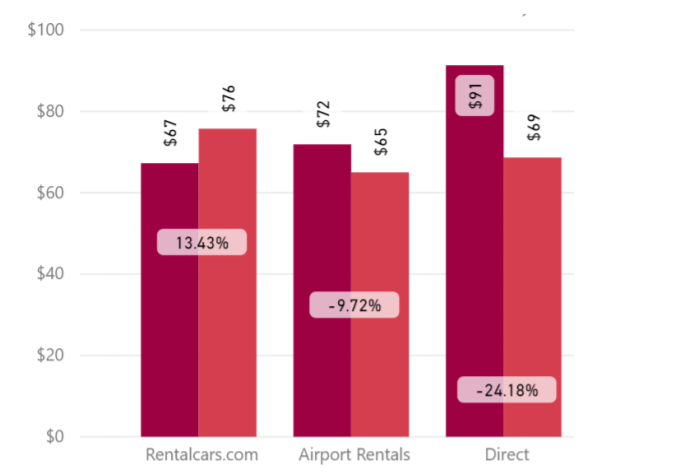
Fig. 23
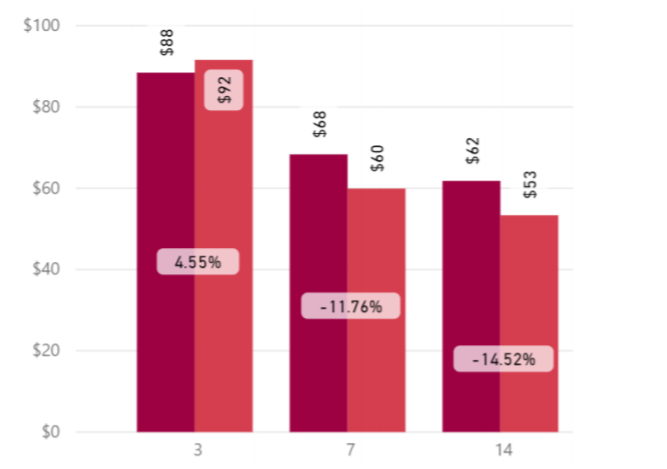
Fig. 24
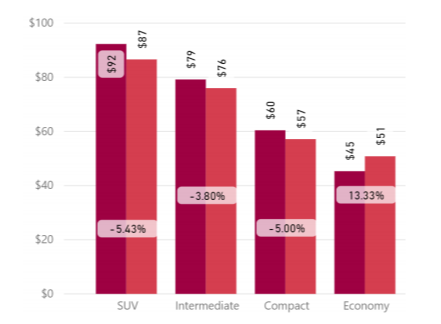
Fig. 25