

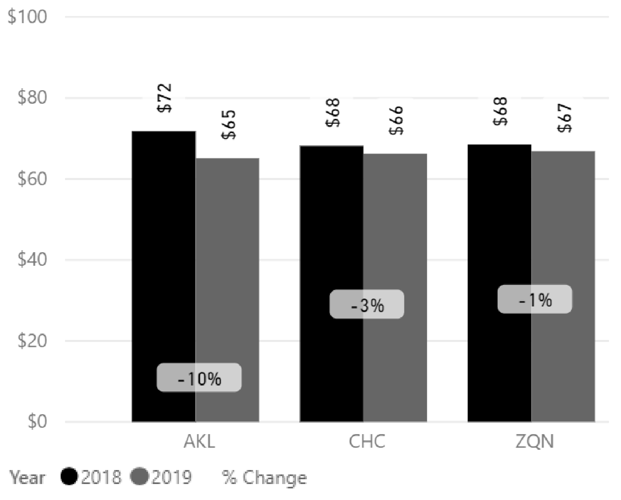
Fig. 1
Refer to sales channels (Fig.2), duration (Fig.3) and vehicle category (Fig.4) graphs for the average rates during the month. As was the trend in prior months, the average rates for the shorter 3-day duration remains strong.
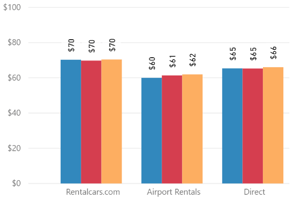
Fig. 2
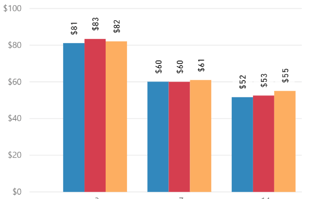
Fig. 3
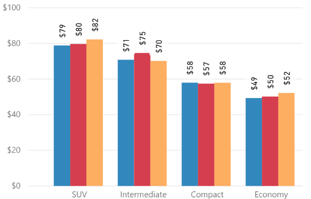
Fig. 4

Overall Auckland Airport had a YoY average rate decrease of -10%.
Rentalcars.com sales channel average rate was flat, while Airport Rentals and the direct channels showed decreases of -17% and -13% respectively (Fig. 5).
The average rate for 3-day duration decreased -4%, while the average rate for longer 7-day was -10%, and 14-day duration -17% (Fig. 6).
The average rate for SUV’s in Auckland was -11% YoY, with all other categories showing average rates of between +2% and -8% (Fig. 7).
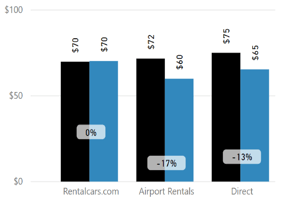
Fig. 5
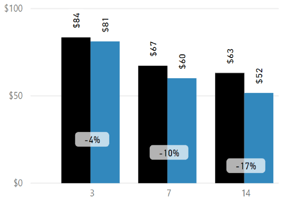
Fig. 6
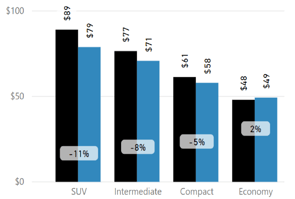
Fig. 7
Overall Christchurch Airport had a YoY average rate decrease of -3%.
Rentalcars.com sales channel showed an average rate increase of +3%, while Airport Rentals and the direct channels showed decreases of -12% and -4% respectively (Fig. 8).
The average rate for 3-day durations increased +2%, while the average rate for longer 7-day and 14-day durations were lower by -5% and -10% respectively (Fig. 9).
The average rate for SUV’s was down -4%, with all other categories showing average rates of between +1% and -8% (Fig. 10).
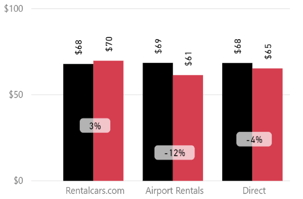
Fig. 8
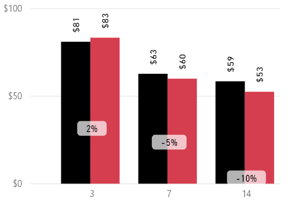
Fig. 9
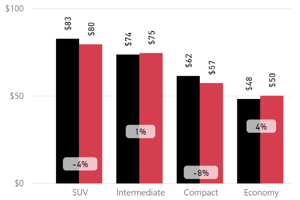
Fig. 10
Overall Queenstown Airport had a YoY average rate decrease of -1%.
The rentalcars.com sales channel showed an average rate increase of +6%, while Airport Rentals and the direct channels showed decreases of between -16% and -4% respectively (Fig. 11).
The average rate for a 3-day duration decreased -2%, while the average rate for longer 7-day and 14-day flat and -4% respectively (Fig. 12).
The average rate for SUV’s was down -2%, with all other categories showing average rates of between +8% and -4% (Fig. 13).
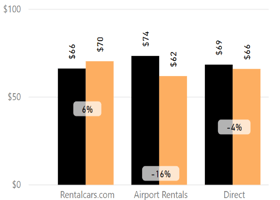
Fig. 11
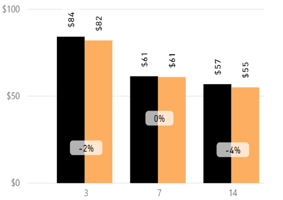
Fig. 12
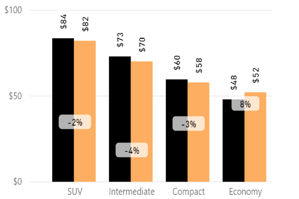
Fig. 13
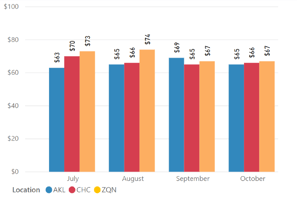
Fig. 14
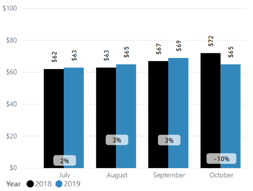
Fig. 15
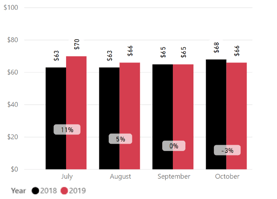
Fig. 16
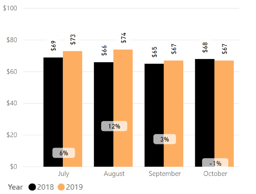
Fig. 17
Overall average rates remain soft the coming month (Fig.18). The average rates begin to build from mid-December 2019, and are very strong over the Christmas/New Year season from 23rd December 2019 to 5th January 2020 (Fig.19 to Fig.21).
Market Insider Tip:
November 2019 is looking soft compared to last year.
As noted in previous reports, rates will require active management. Targeted campaigns, pricing specials and channel distribution strategies will also help move inventory.
However, fleet management should be paramount as you do not want to left under fleeted in key summer markets, mainly Auckland.
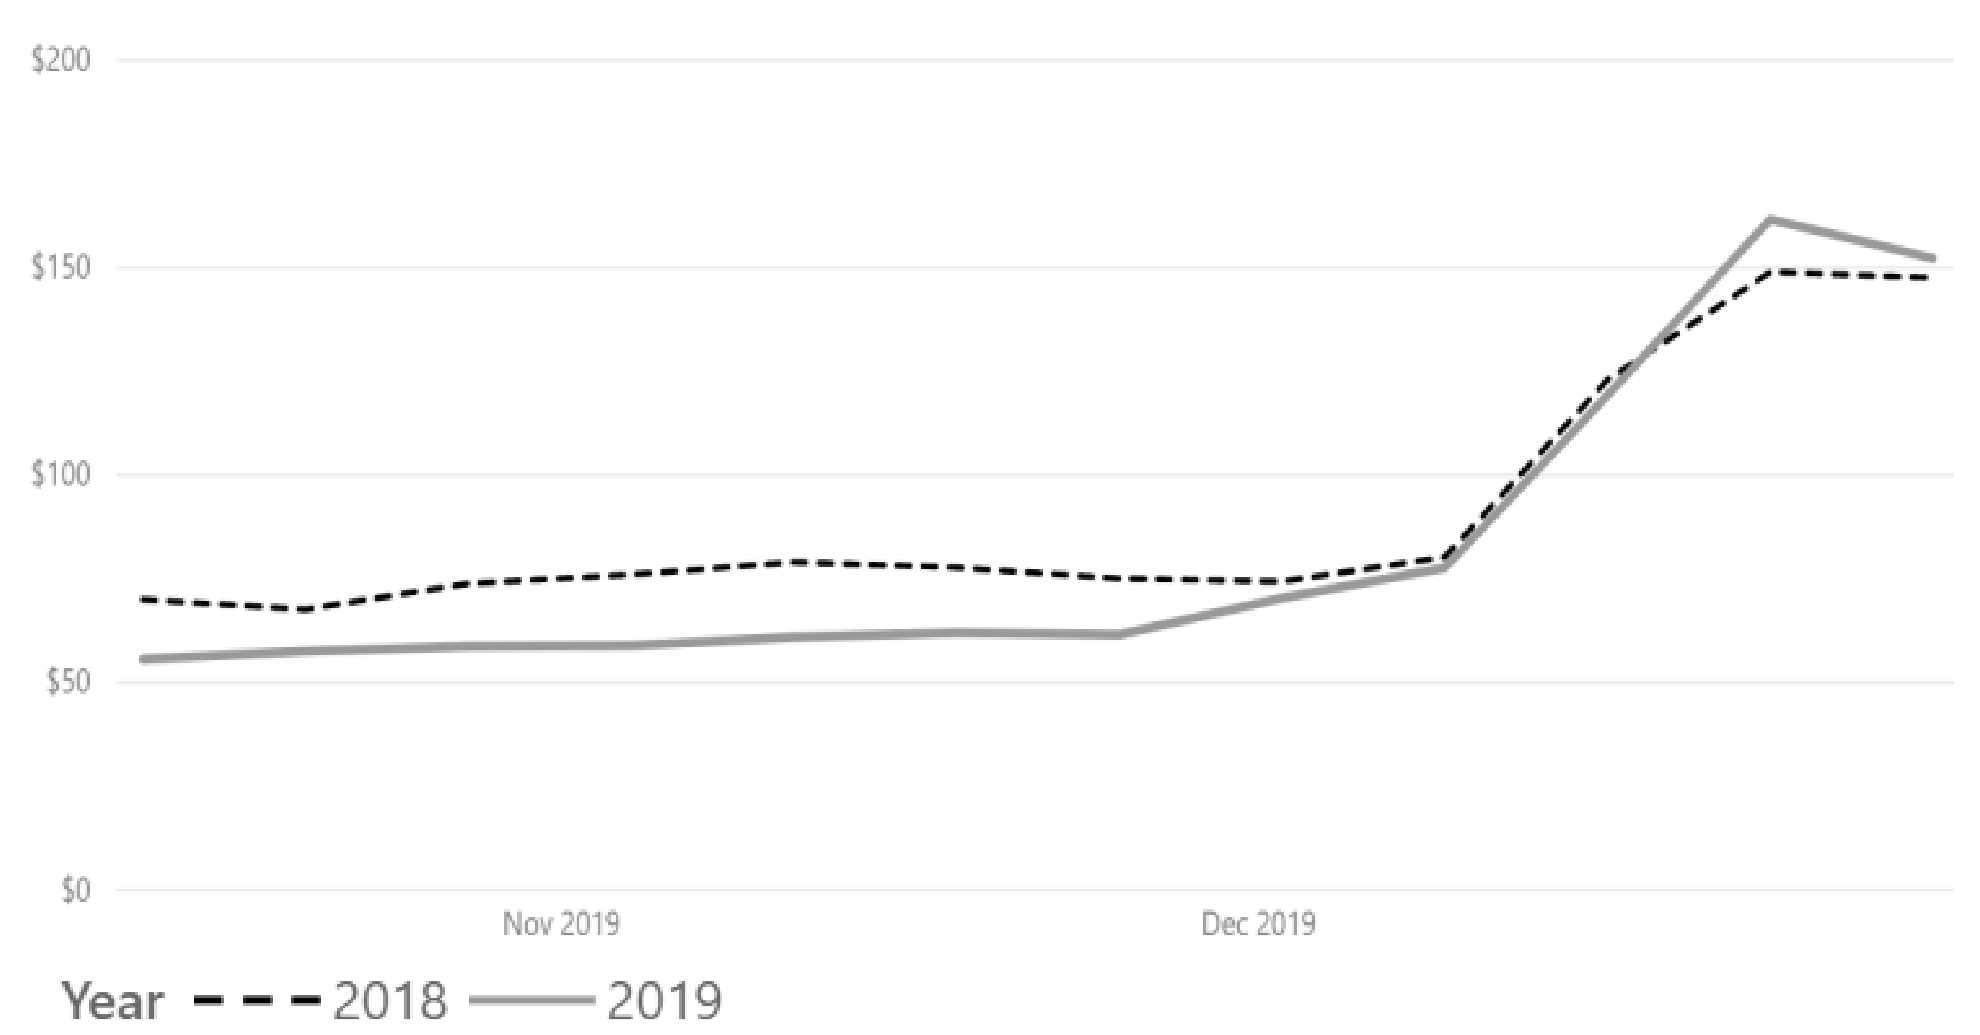
Fig. 18
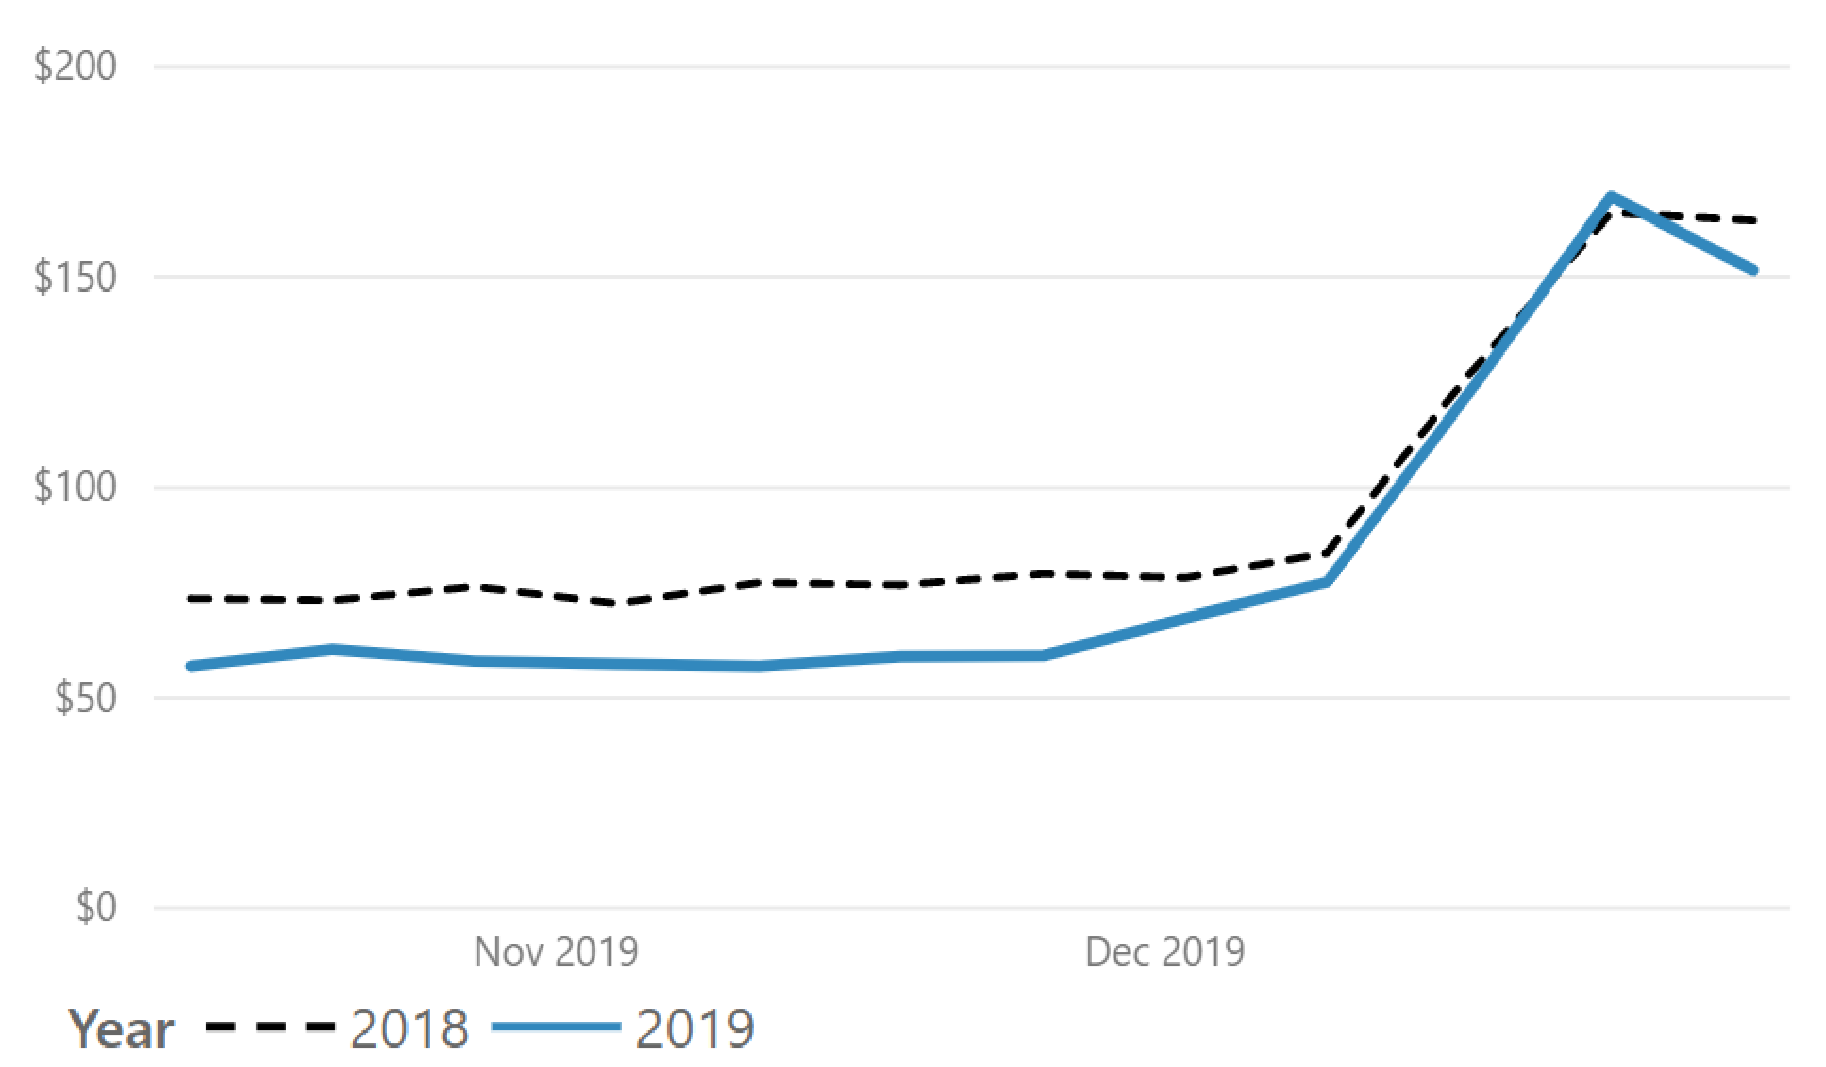
Fig. 19
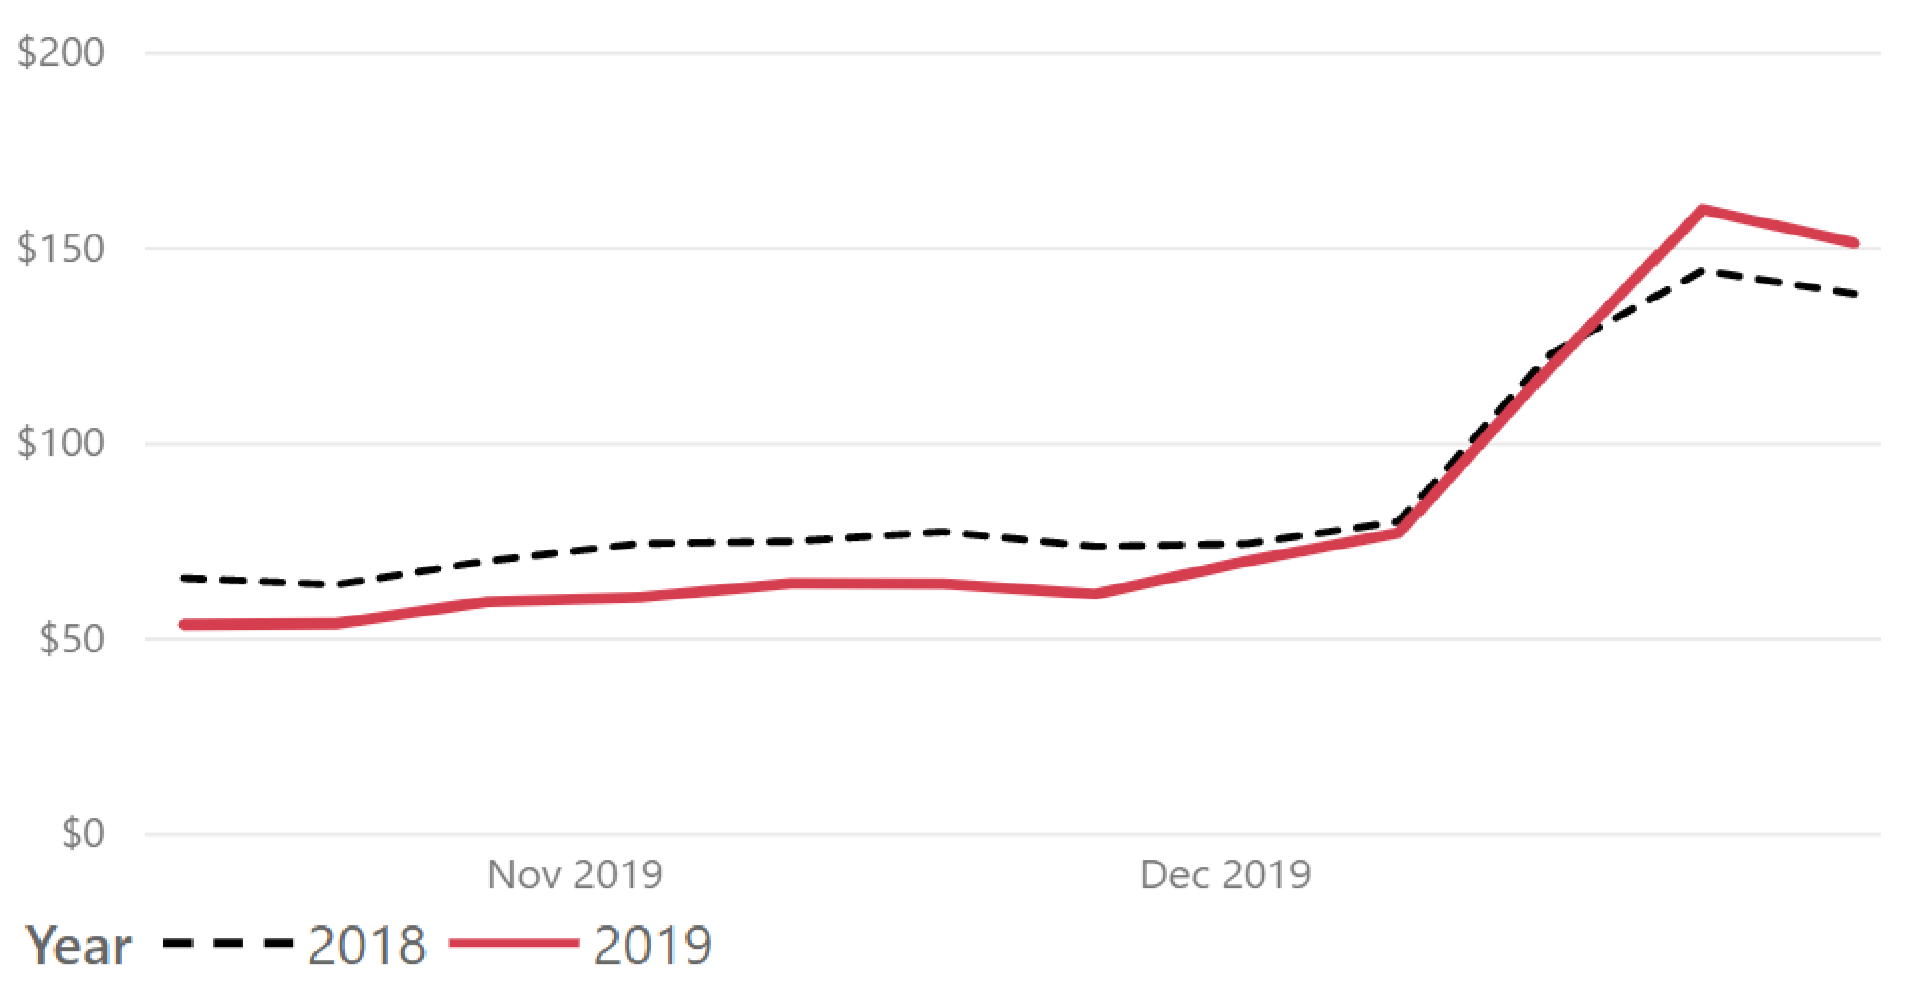
Fig. 20
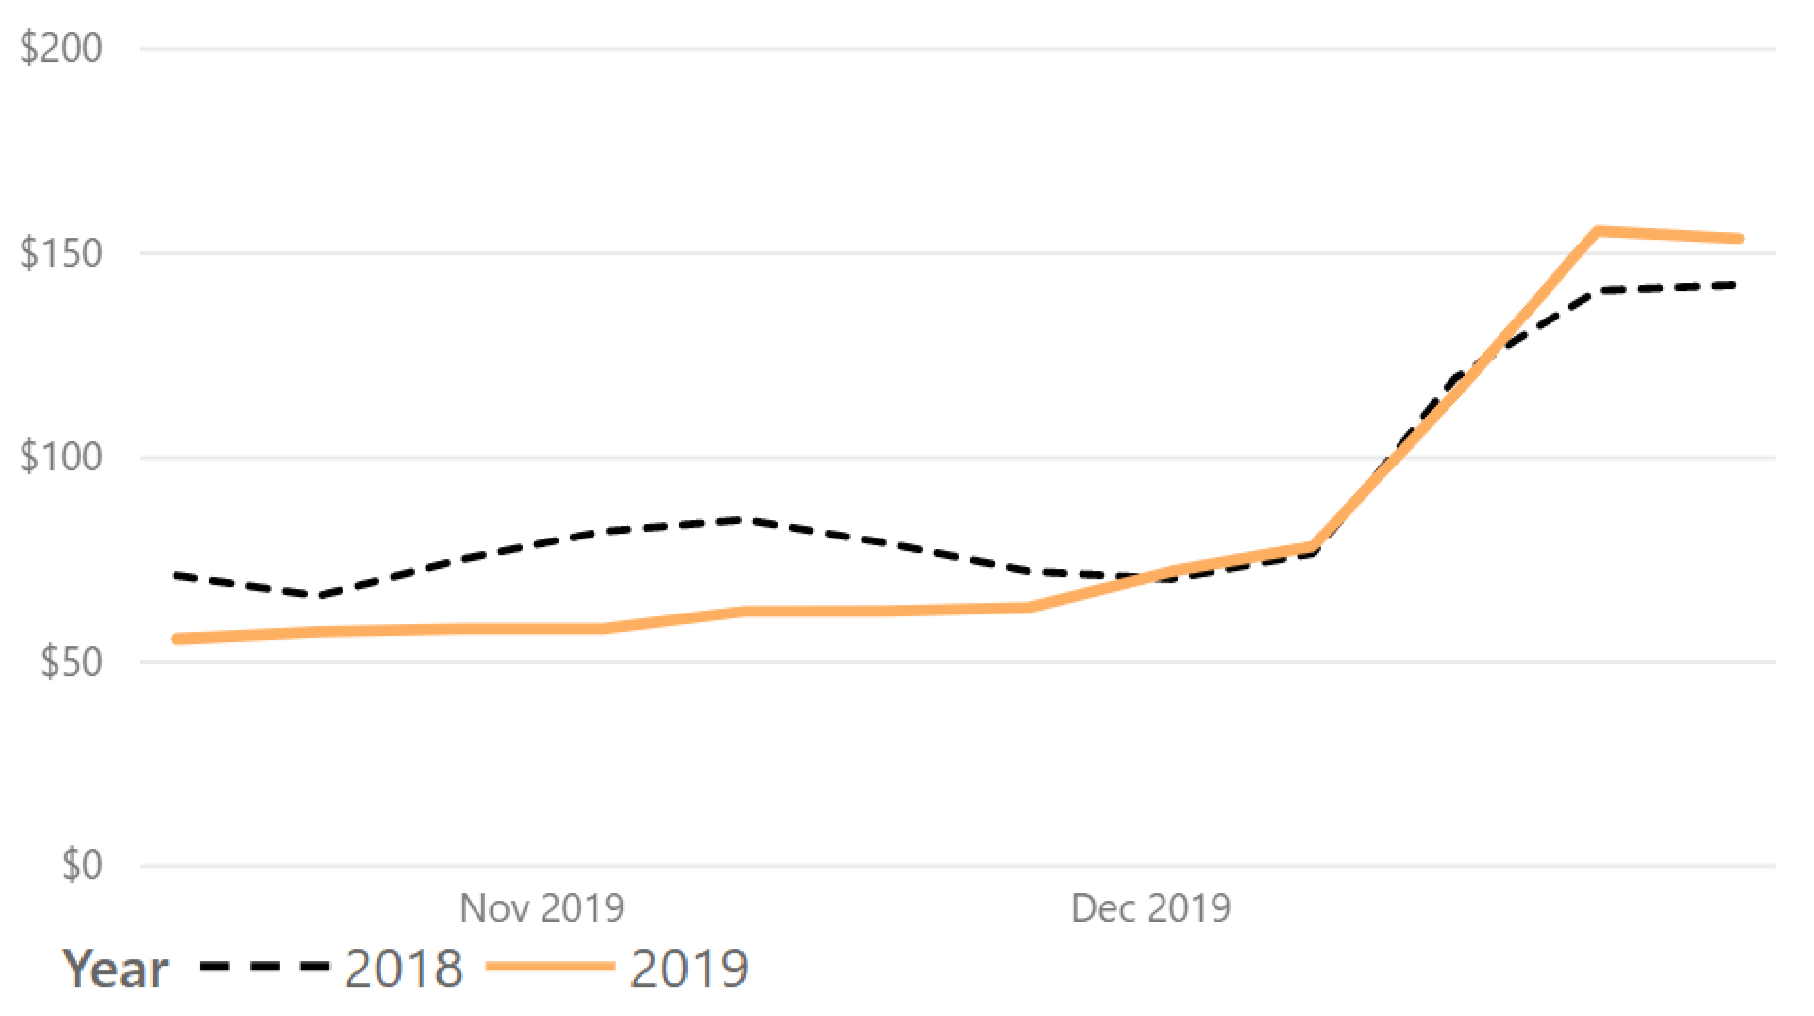
Fig. 21