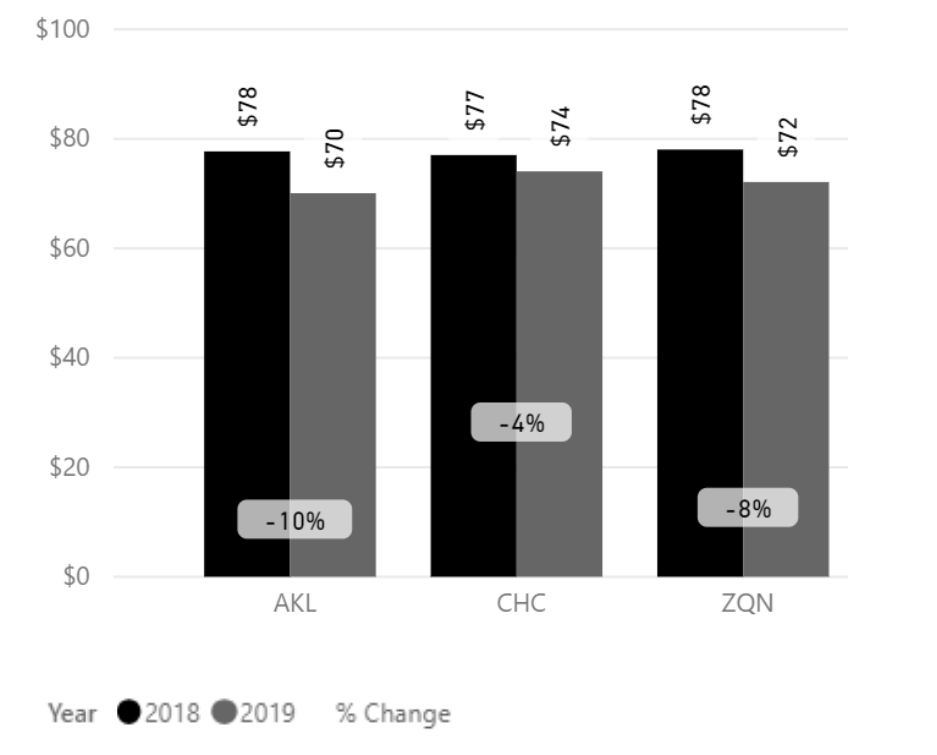
Fig. 1
Refer to sales channels (Fig.2), duration (Fig.3) and vehicle category (Fig.4) graphs for the average rates during the month. As we approach the peak season the average rates for the longer 7 and 14-day durations are increasing, as are rates for the smaller vehicle categories.
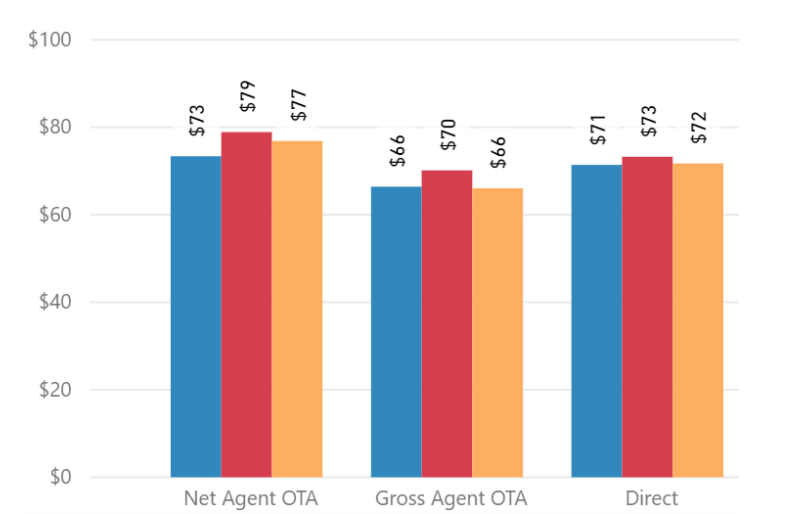
Fig. 2
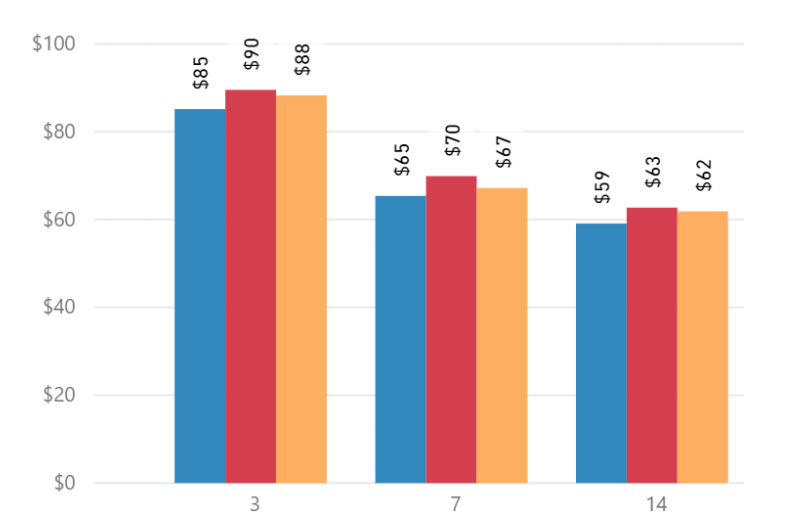
Fig. 3
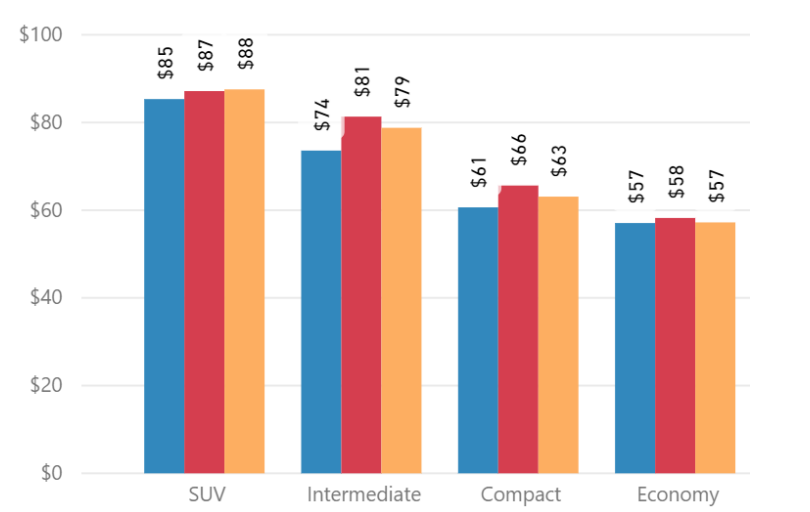
Fig. 4

Overall Auckland Airport had a YoY average rate decrease of -10%.
The Net Agent OTA sales channel average rate was -8% lower, while the Gross Agent OTA and the direct sales channels showed decreases of -13% and -8% respectively (Fig. 5).
The average rate for 3-day duration decreased -7%, while the average rate for longer 7-day was -11%, and 14-day duration -13% (Fig. 6).
The average rate for SUVs in Auckland was -11% YoY, with all other categories showing average rates of between -2% and -11% (Fig. 7).
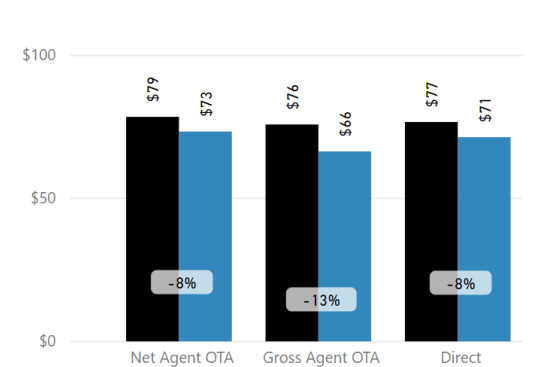
Fig. 5
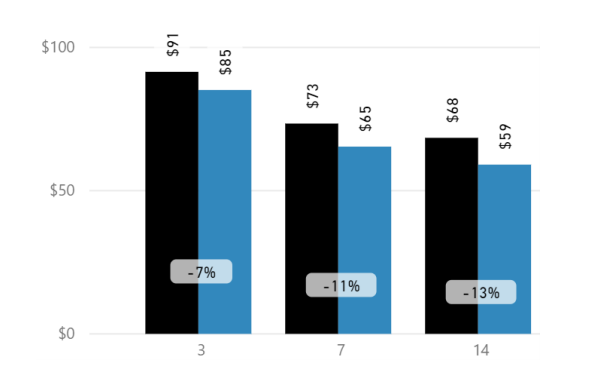
Fig. 6
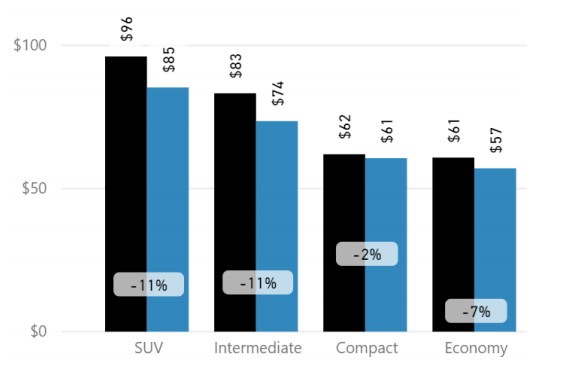
Fig. 7
Overall Christchurch Airport had a YoY average rate decrease of -4%.
The Net Agent OTA sales channel average rate was +1%, while the Gross Agent OTA and the direct sales channels showed decreases of -9% and -4% respectively (Fig. 8).
The average rate for 3-day duration decreased -5%, while the average rate for longer 7-day and 14-day durations were lower by -3% (Fig. 9).
The average rate for SUVs was down -11%, with all other categories showing average rates of between +2% and -2% (Fig. 10).
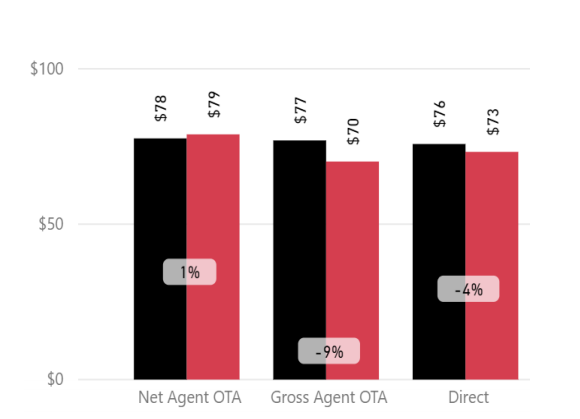
Fig. 8
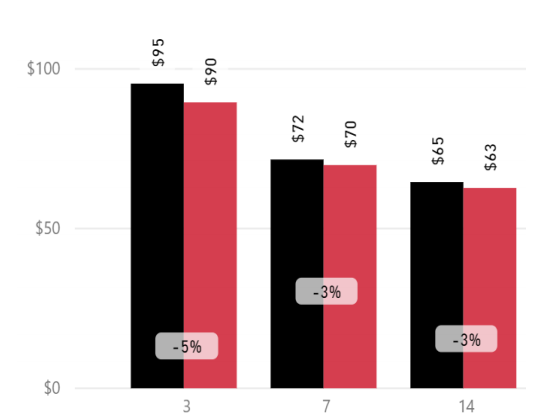
Fig. 9
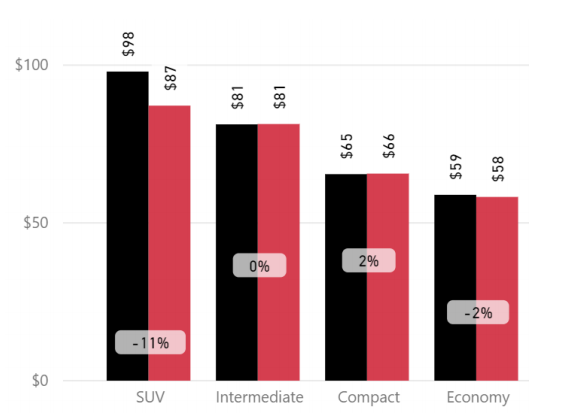
Fig. 10
Overall Queenstown Airport had a YoY average rate decrease of -8%.
The Net Agent OTA sales channel average rate was -1%, while the Gross Agent OTA and the direct sales channels showed decreases of -18% and -6% respectively (Fig. 11).
The average rate for a 3-day duration decreased -9%, while the average rate for longer 7-day and 14-day -7% and -6% respectively (Fig. 12).
The average rate for SUVs was down -9%, with all other categories showing average rates of between -3% and -7% (Fig. 13).
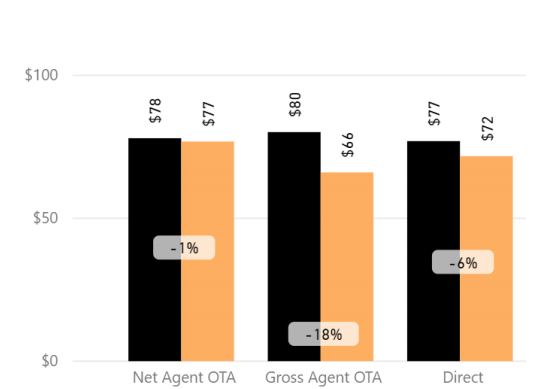
Fig. 11
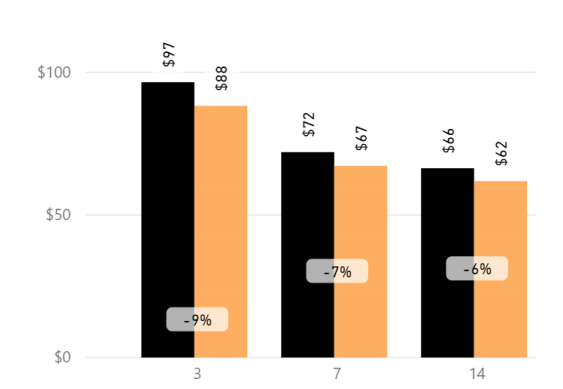
Fig. 12
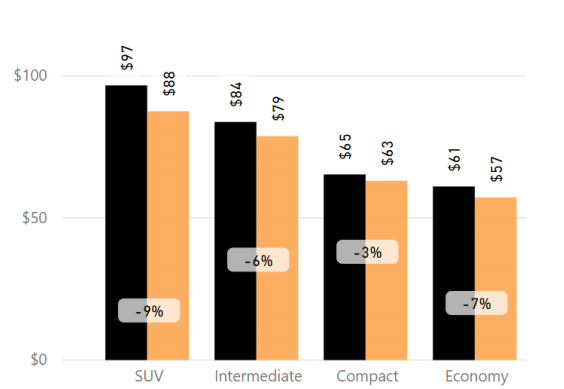
Fig. 13
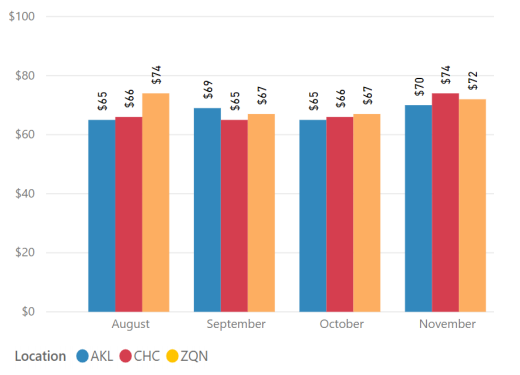
Fig. 14
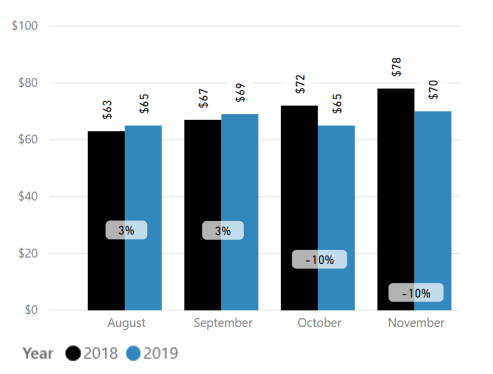
Fig. 15
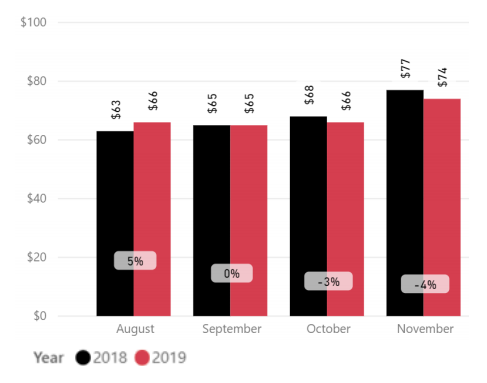
Fig. 16
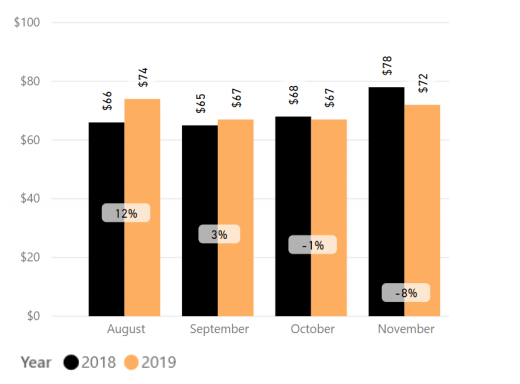
Fig. 17
Overall average rates are a little soft in the lead up to, and through the Christmas season (Fig.18). Average rates remain strong throughout January 2020, but start to trend lower from early February 2020 due in part to the seasonal timing of Chinese New Year (Fig.19 to Fig.21).
Market Insider Tip:
Chinese New Year is a couple of weeks earlier in 2020 compared to 2019, and this will have a material impact on revenue during this period.
To allow for the potential shortfall in February revenue, focus will be on maximizing revenue as a result of all the seasonal holidays falling into what is effectively an extended long weekend. One way to do this is with targeted campaigns, such as the weekend promotions.
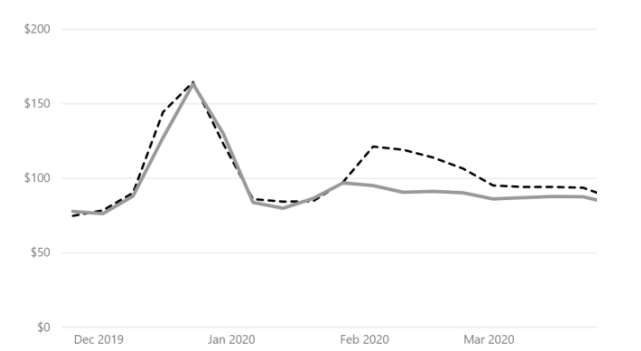
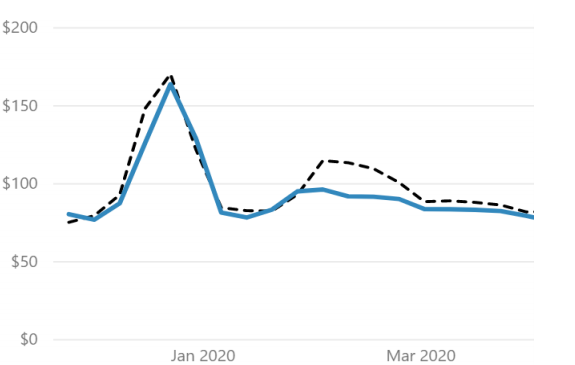

Fig. 18

Fig. 19
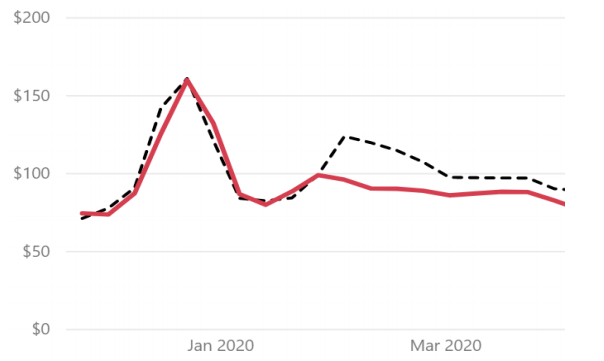
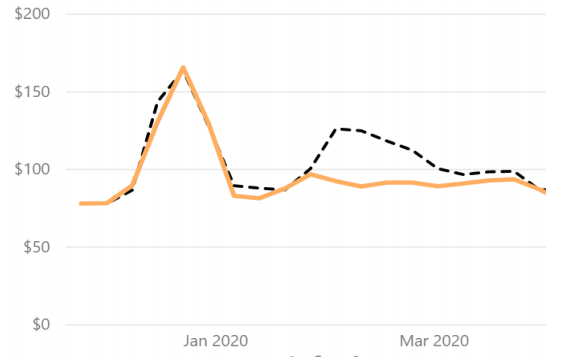

Fig. 20

Fig. 21
Market Insider Tip:
Manage your channels effectively. As demand builds on direct channels, make the most of the favourable yields.
Your channels need active management, so make sure you are on top of them.
Having fleet in the right place is once again crucial, with Auckland demand being able to swallow most of the demand at higher rates.
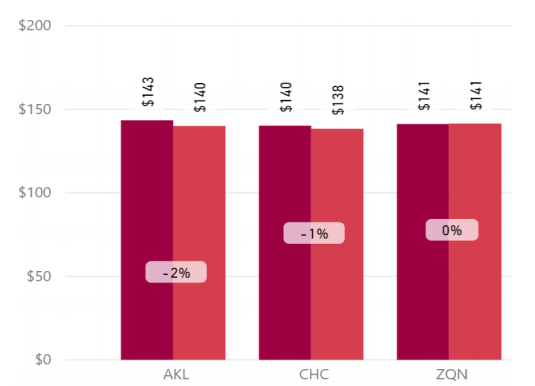
Fig. 22
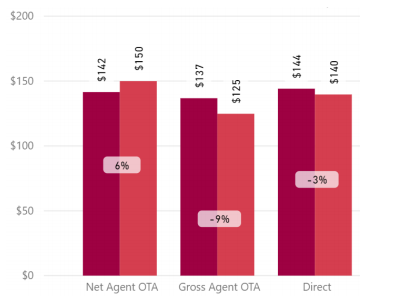
Fig. 23
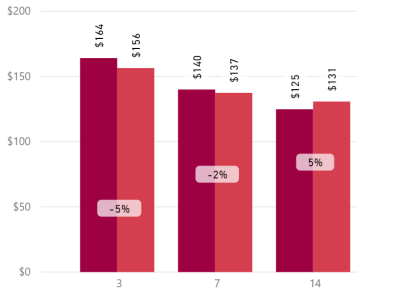
Fig. 24
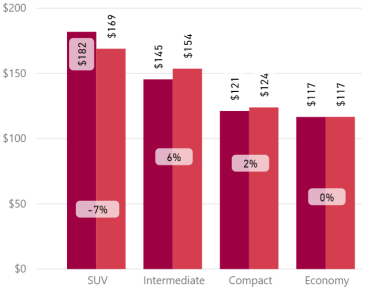
Fig. 25

Market Insider Tip:
The earlier Chinese New Year holiday falls into Auckland Anniversary weekend and the tail of the School Holidays and can extend to Waitangi Day.
Effectively the Chinese New Year holiday period is from 20th January to 9th February 2020, with a bulk of the revenue generation being in late January 2020.
Make sure your fleet mix is correct: traditionally SUVs and 4x4s are very popular in Christchurch.
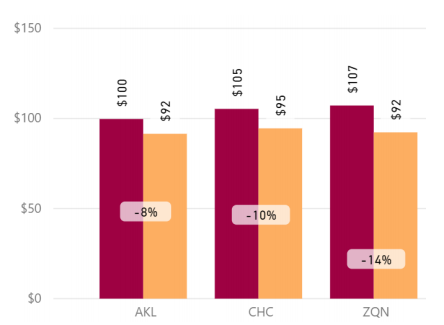
Fig. 26
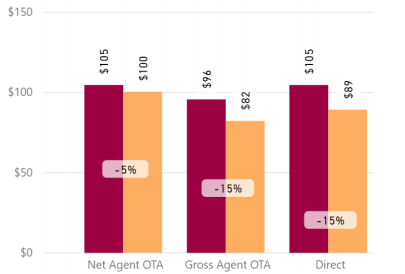
Fig. 27
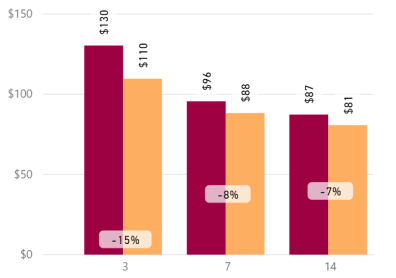
Fig. 28
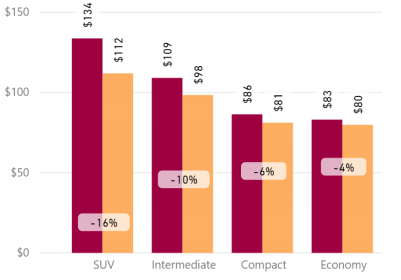
Fig. 29