

Refer to sales channels (Fig.2), duration (Fig.3) and vehicle category (Fig.4) graphs for the average rates during the month. Due to the peak season, the average for all durations and all vehicle categories increased, with the average rates for the SUV class almost doubling from November 2019.
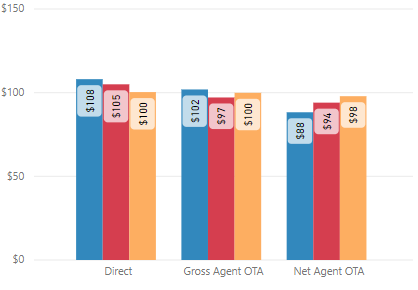
Fig. 2
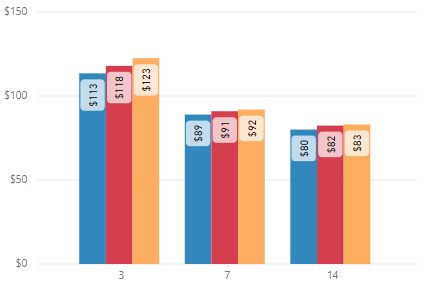
Fig. 3
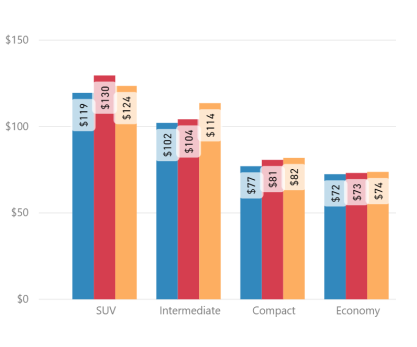
Fig. 4

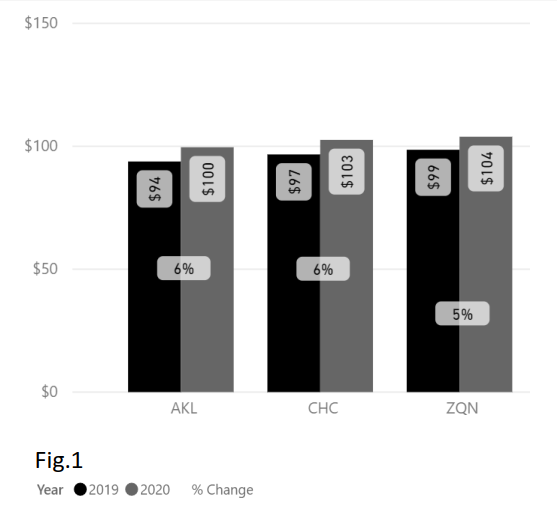
Overall Auckland Airport had a YoY average rate increase of +6% .
The Net Agent OTA sales channel average rate was +19% higher, while the Gross Agent OTA and the Direct sales channels showed decreases of -11% and -6% respectively (Fig. 5).
The average rate for 3-day duration increased +5% , while the average rate for 7-day duration was +4%, and 14-day duration +8% (Fig. 6).
The average rate for SUV’s in Auckland was +6% YoY, with all other categories showed average rate increases of between +3% and +13% (Fig. 7).
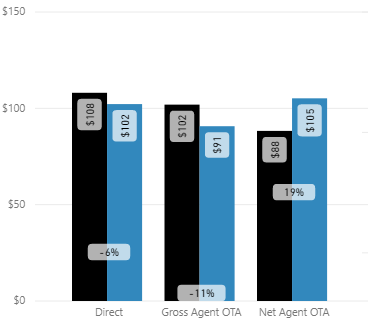
Fig. 5
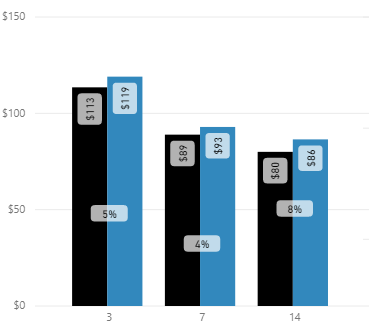
Fig. 6
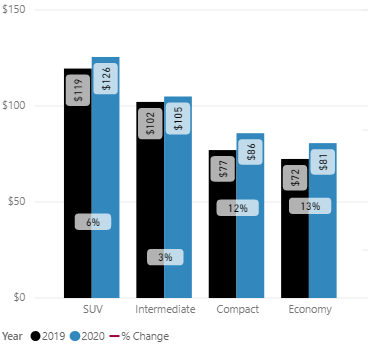
Fig. 7
Overall Christchurch Airport had a YoY average rate increase of +6%.
The Net Agent OTA sales channel average rate was +18%, while the Gross Agent OTA and the Direct sales channels showed decreases of -5% and -1% respectively (Fig. 8).
The average rate for 3-day duration was up +3%, while the average rate for longer 7-day and 14-day durations were higher by +4% and +11% respectively (Fig. 9).
The average rate for SUV’s in Christchurch was up +1%, with all other categories showing average rate increases of between +5% and +11% (Fig. 10).
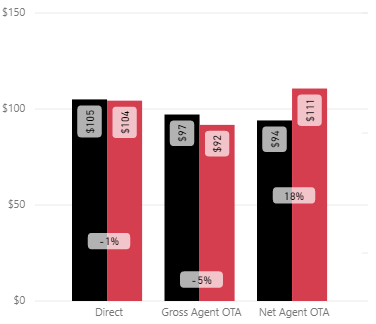
Fig. 8
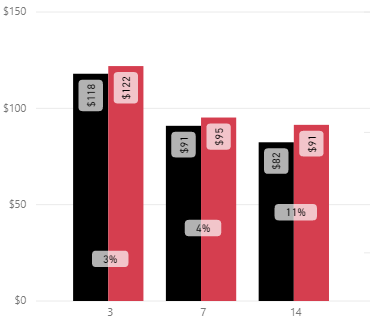
Fig. 9
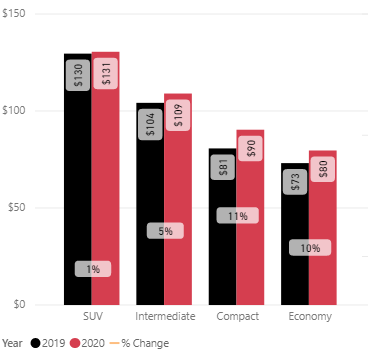
Fig. 10
Overall Queenstown Airport had a YoY average rate increase of +5%.
The Net Agent OTA sales channel average rate was +12%, while the Gross Agent OTA was -7% lower, and the Direct sales channels showed an increase of +5% (Fig. 11).
The average rate for a 3-day duration decreased -2%, while the average rate for longer 7-day and 14-day durations were up between +8% and +12% respectively (Fig. 12).
The average rate for SUV’s in Queenstown was up +4%, and all other categories showed average rate movement of between -1% and +12% (Fig. 13).
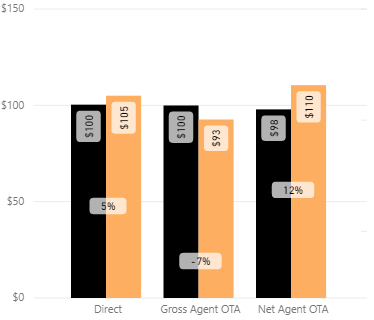
Fig. 11
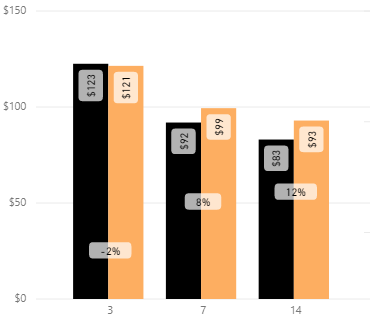
Fig. 12
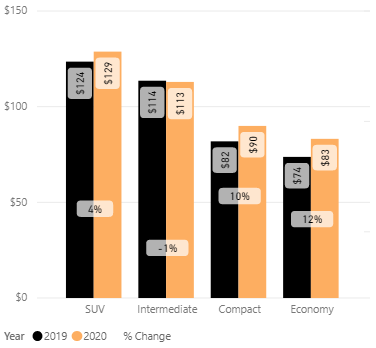
Fig. 13
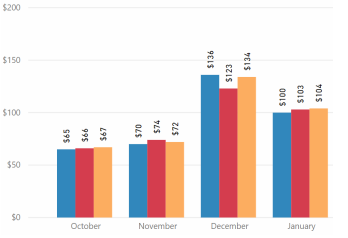
Fig. 14
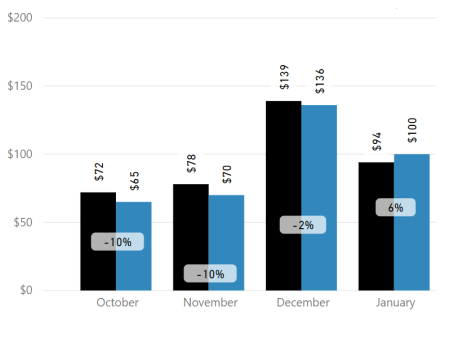
Fig. 15
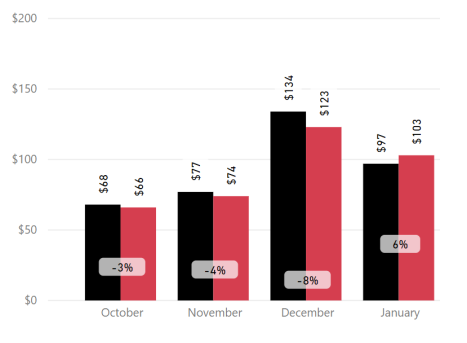
Fig. 16
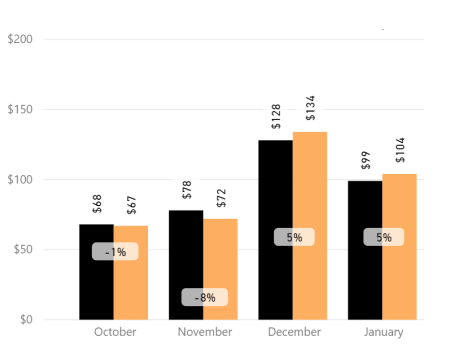
Fig. 17

As noted in the December 2019 report, the average rate was below last year for the first week of January 2020, however, there after the remainder tracked ahead of last year due to the seasonal timing of Chinese New Year (Fig.18). The flipside of the strong January 2020 is a projected
weakening of rates from February 2020, again attributable to Chinese New Year, the trend is for all regions (Fig.19 to Fig.21 ).
Market Insider Tip:Market Insider Tip:
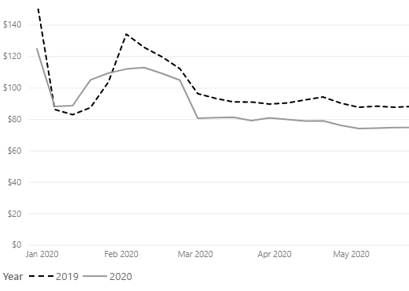
Fig. 18
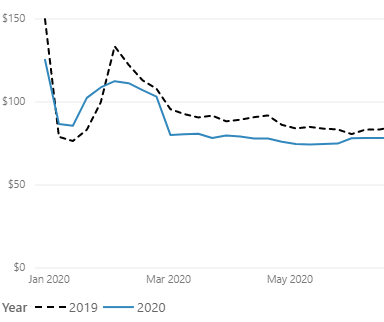
Fig. 19
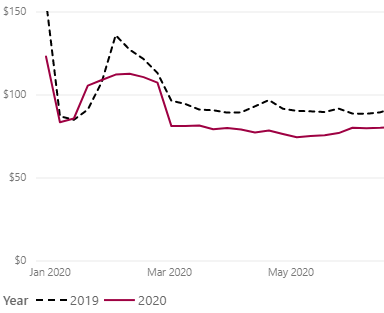
Fig. 20
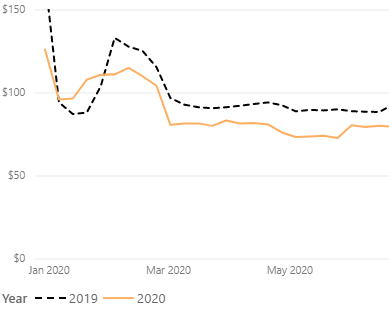
Fig. 21