

Refer to sales channels (Fig.2), duration (Fig.3) and vehicle category (Fig.4) graphs for the average rates during the month. As it is still peak season, the average rate for all durations and vehicle categories remains high as is the seasonal norm during the peak season .
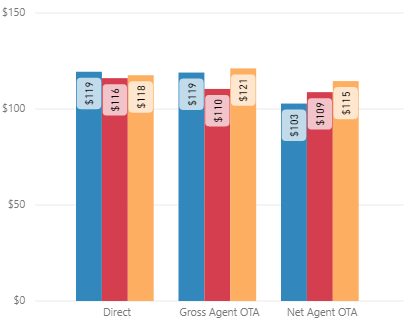
Fig. 2
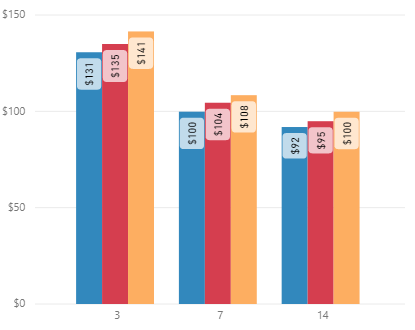
Fig. 3
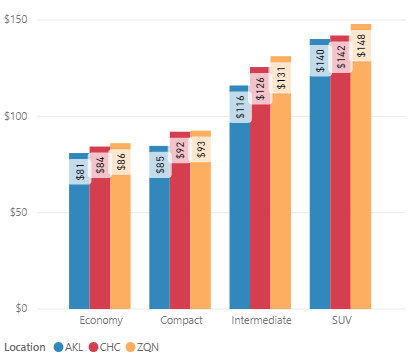
Fig. 4
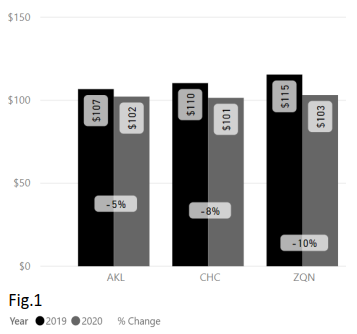
Overall Auckland Airport had a YoY average rate decrease of -5%.
The Direct sales channel average rate was -13% lower, the Gross Agent OTA decreased -22%, while the Net Agent OTA sales channels showed an increase +7% (Fig. 5).
The average rate for 3-day duration decreased -9%, while the average rate for 7-day duration was -1%, and 14-day duration -4% (Fig. 6).
The average rate for the larger vehicle classes, SUV and Intermediate were lower by -8% and -9% respectively, while the smaller Compact and Economy vehicles were up between +4% and +2% (Fig. 7).
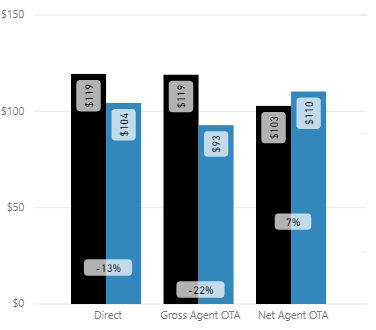
Fig. 5
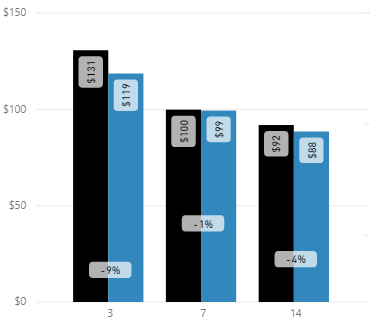
Fig. 6
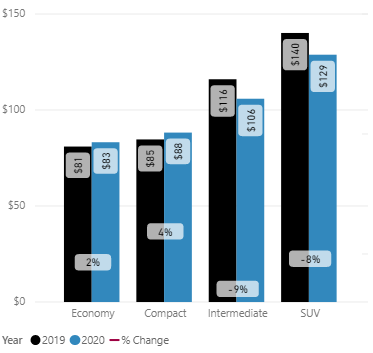
Fig. 7
Overall Christchurch Airport had a YoY average rate decrease of -8%.
The Direct sales channel average rate was -10% lower, the Gross Agent OTA decreased -17%, while the Net Agent OTA sales channels showed a decrease of -1% (Fig. 8).
The average rate for 3-day duration decreased -11%, while the average rate for 7-day duration was -8%, and 14-day duration -6% (Fig. 9).
The average rate for the larger vehicle classes, SUV and Intermediate were lower by -12% and -15% respectively, while the smaller Compact and Economy vehicles were lower between -3% and -2% (Fig. 10).
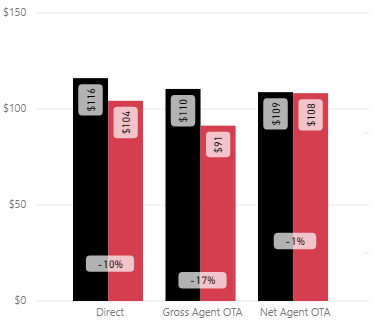
Fig. 8
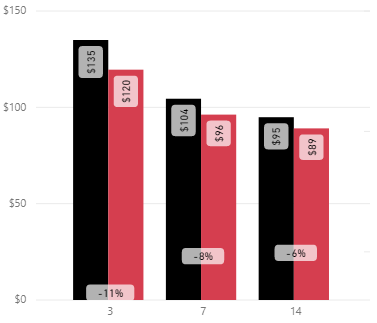
Fig. 9
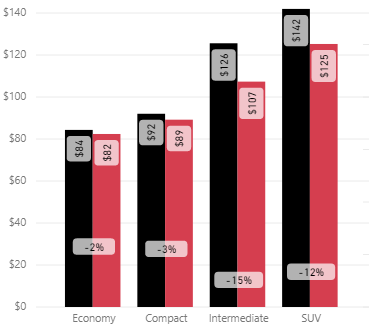
Fig. 10
Overall Queenstown Airport had a YoY average rate decrease of -10%.
The Direct sales channel average rate was -10% lower, the Gross Agent OTA decreased -23%, while the Net Agent OTA sales channels showed a decrease of -4% (Fig. 11).
The average rate for 3-day duration decreased -16%, while the average rate for 7-day duration was -7%, and 14-day duration -7% (Fig. 12).
The average rate for the larger vehicle classes, SUV and Intermediate lower by -14%, while the smaller Compact and Economy vehicles were lower between -5% and -3% (Fig.13).
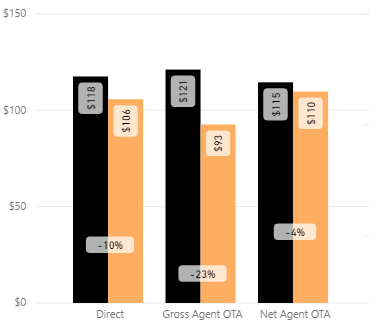
Fig. 11
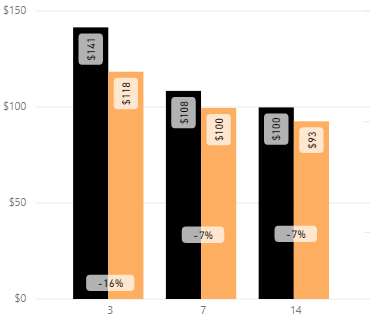
Fig. 12
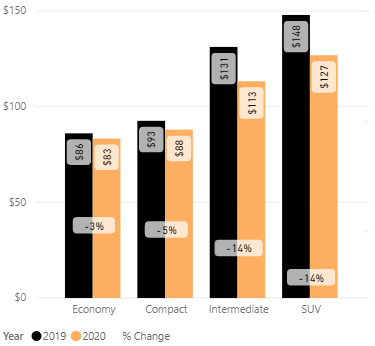
Fig. 13
Fig. 14
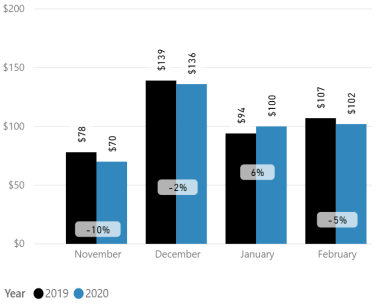
Fig. 15
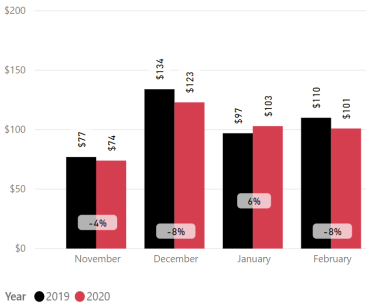
Fig. 16
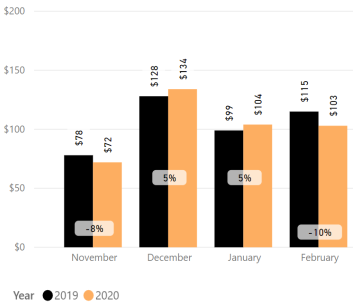
Fig. 17
As noted in the previous report, the strong January 2020 month (largely due to the seasonal timing of national & school holidays, along with
Chinese New Year) was followed by a softer February 2020 (Fig.18), and these trends were consistent for all regions (Fig.19 t o Fig.21). At the time of writing the report impacts of the Coronavirus were starting to show, and this will be fully reflective in the March 2020 r eport.
Market Insider Tip:
The near term forward market is softening as a result of the Coronavirus per Fig.18 to Fig21.
However, the weaker international demand during the coming months can be managed using a number of pricing and fleet strategies, such as, domestic & Australian pricing campaigns, and tight fleet management based on
forecasting.
We will be working our customers to assist them with strategies and making best use of the MarginFuel forecast over the coming months.
There is also a trend of later than normal cancellations as customers leave travel decisions to the last minute, along with a high portion of postponed travel. Again, these are modelled in the MarginFuel forecast and have a very
unique trend profile.
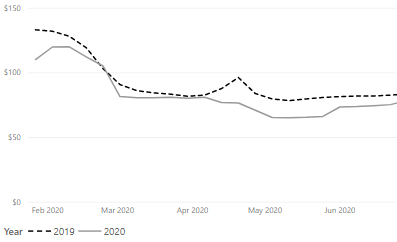
Fig. 18
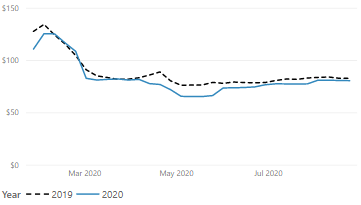
Fig. 19
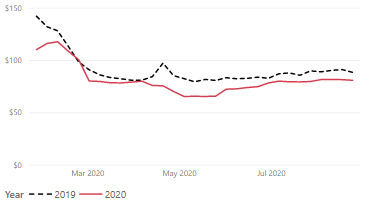
Fig. 20
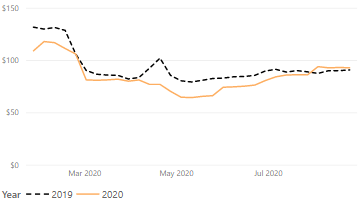
Fig. 21
Market Insider Tip:
The Easter 2020 season will take proactive,
controlled strategies to ensure tight pricing and fleet management, as we expect there to be a material impact as a result of the Coronavirus.
The severity of the impact for Easter 2020 will be primarily dependant on the containment of the virus in New Zealand and Australia.
Being fully aware of competitor pricing, along with utilising the MarginFuel forecast are key elements in understanding the marketplace,
which will in turn remove uncertainty.
Make sure your fleet mix is correct: traditionally SUVs and 4x4s are very popular in Christchurch.
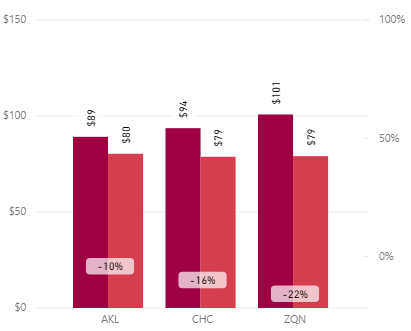
Fig. 22
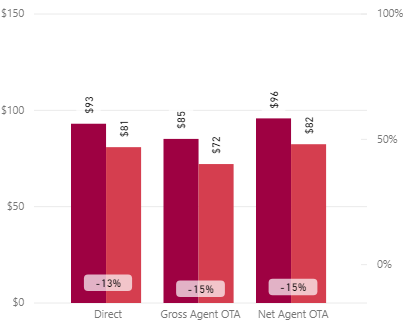
Fig. 23
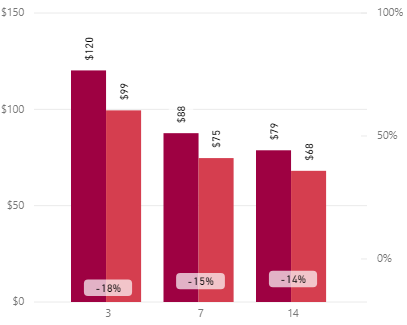
Fig. 24
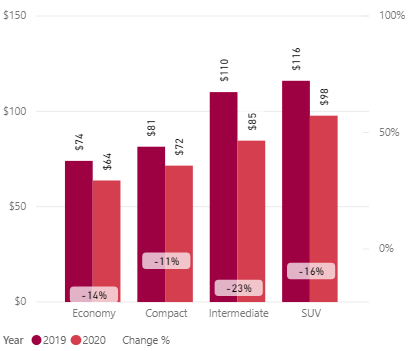
Fig. 25