

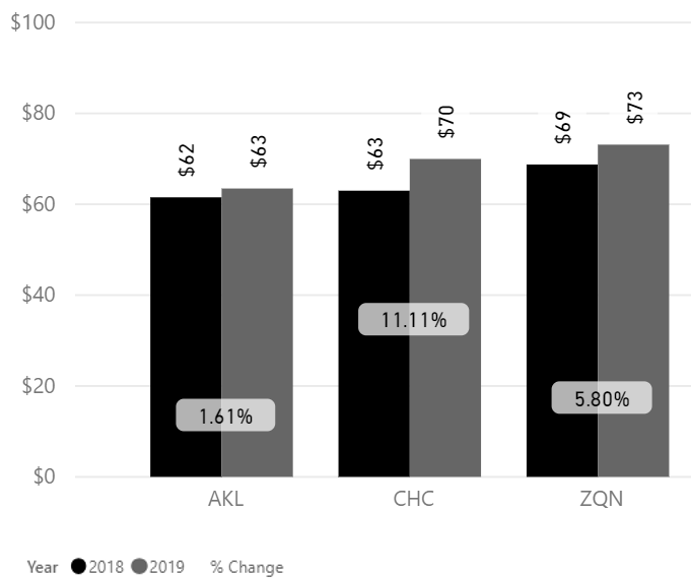
Fig. 1
Refer to sales channels (Fig.2), duration (Fig.3) and vehicle category (Fig.4) graphs for the average rates in July 2019. As is seasonally expected, average rates for SUVs from Christchurch and Queenstown Airports are higher than Auckland. As was the trend in June 2019, average rates for the shorter 3-day duration remains very strong.
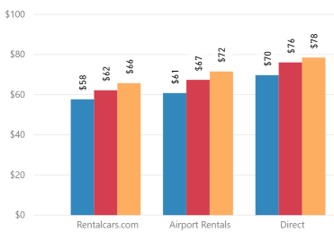
Fig. 2
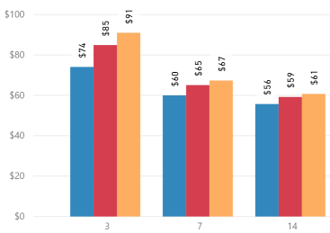
Fig. 3
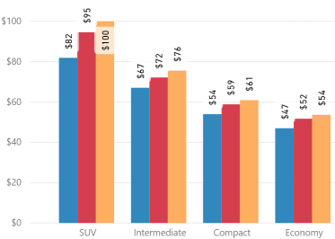
Fig. 4
Overall Auckland Airport had a YoY average rate increase of +2%.
Rentalcars.com sales channel showed an average rate decrease of -8%, while Airport Rentals and the direct channels showed increases of +3% and +13% respectively (Fig. 5).
The average rate for 3-day duration increased +9%, while the average rate for longer 7-day was flat, and 14-day duration; -2% (Fig. 6).
The average rate for SUVs in Auckland +1% YoY, with all other categories showing average rate increases of between +2% and +7% (Fig. 7).
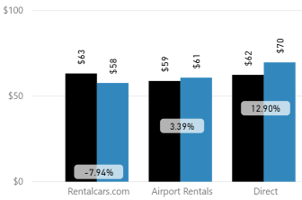
Fig. 5
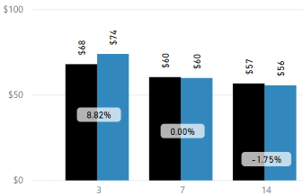
Fig. 6
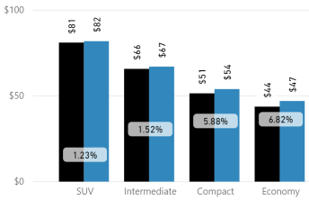
Fig. 7
Overall Christchurch Airport had a YoY average rate increase of +11%.
Rentalcars.com sales channel showed an average rate decrease of -5%, while Airport Rentals and the direct channels showed increases of +14% and +19% respectively (Fig. 8).
The average rate for 3-day durations increased +18%, while the average rate for longer 7-day and 14-day durations increased by +7% and +4% respectively (Fig. 9).
The average rate for SUVs was up +12%, with all other categories increasing between +6% and +21% (Fig. 10).
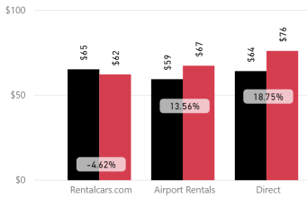
Fig. 8
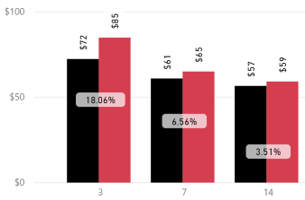
Fig. 9
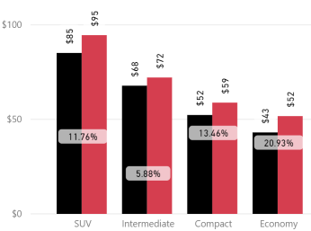
Fig. 10
Overall Queenstown Airport had a YoY average rate increase of +6%.
The rentalcars.com sales channel showed an average rate decrease of -6%, while Airport Rentals and the direct channels showed increases of between +9% and +11% respectively (Fig. 11).
The average rate for a 3-day duration increased +14%, while the average rate for longer 7-day and 14-day +2% and flat respectively (Fig. 12).
The average rate for SUVs was up +3%, with all other categories increasing between +7% and +15% (Fig. 13).
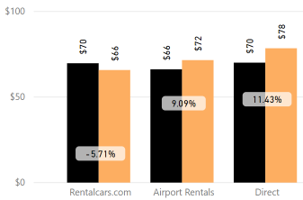
Fig. 11
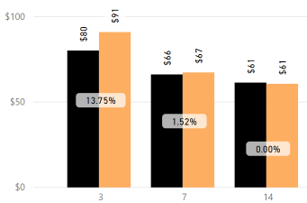
Fig. 12
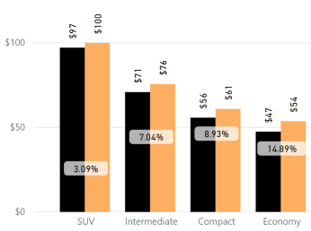
Fig. 13
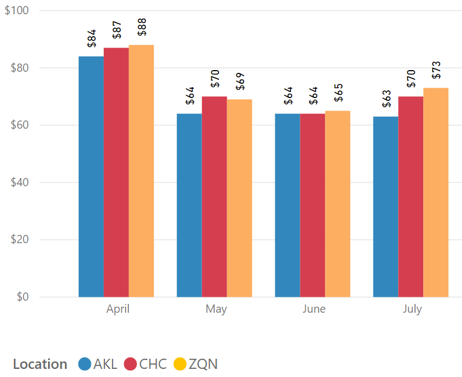
Fig. 14
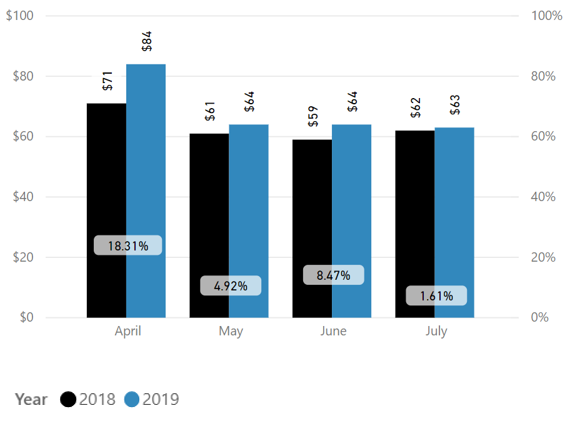
Fig. 15
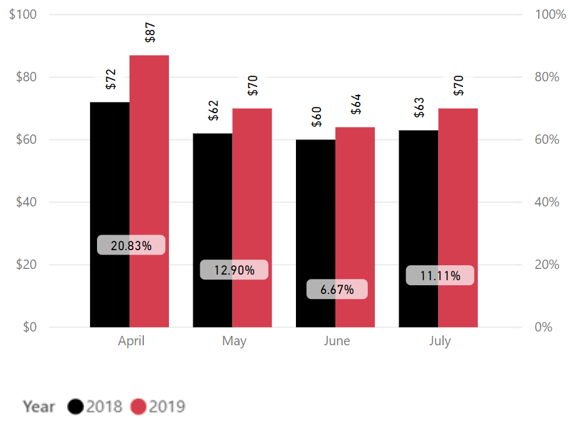
Fig. 16
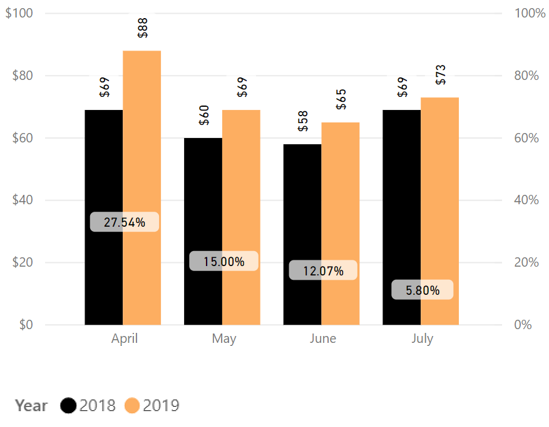
Fig. 17
Overall average rates for the coming months remain variable. For August the trend is above prior year, however as noted in last month’s report there is a potential YoY soft spot between September to November 2019 (Fig.18). The early average rate build for December 2019 is encouraging, however, those rates will firm up from November. The overall trend is consistent for all three locations (Fig.20 to Fig.21).
Market Insider Tip:
As the midpoint of the winter season is upon us the focus squarely remains on servicing South Island demand, with fleet mix remaining top of mind.
Early pricing suggests August 2019 will remain fairly stable but plan now for a period of YoY weakness between September and November 2019.
However, keep one eye on the Auckland build profile late in the winter season to ensure fleet is on hand in Auckland to service upcoming demand.
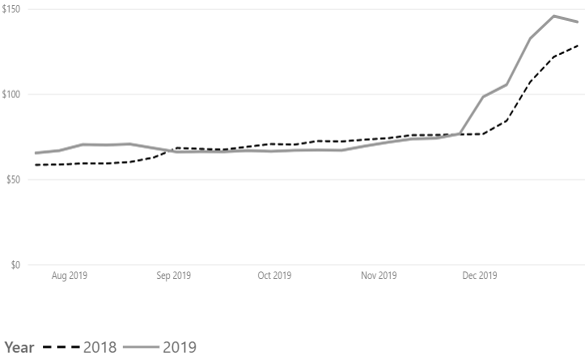
Fig. 18
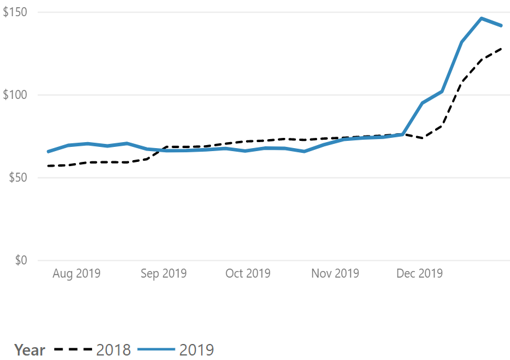
Fig. 19
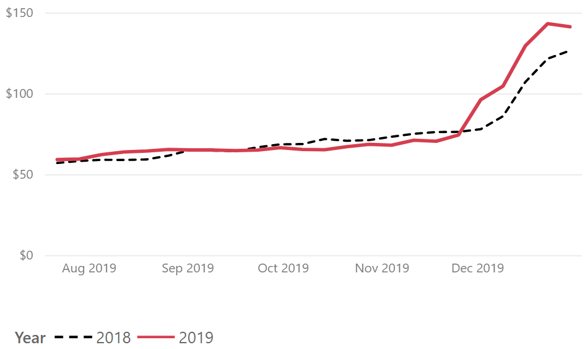
Fig. 20
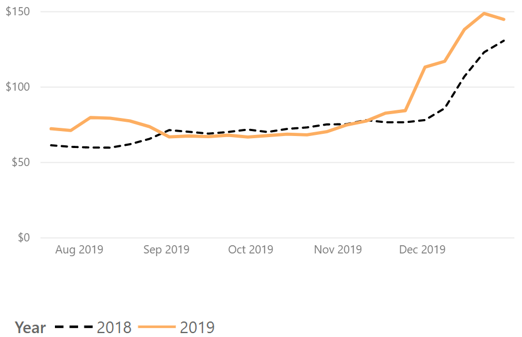
Fig. 21